Debugging WebAssembly with modern tools

summary
Chrome DevTools plus Emscripten provide source-level debugging for C++ compiled to WebAssembly: raw disassembly shows unreadable locals but installing the Wasm debugging extension and emitting DWARF lets DevTools show original C++ files, step over expressions, and inspect typed variables. The demos compile a small Fibonacci and Mandelbrot demos to WASM and succeed in stepping through real and imaginary parts and palette colors. Splitting debug info out with split-out DWARF reduces binary by ~30KB for the example; Google Earth uses this workflow on large C++ builds.
AI-written summary · about
chapters (4)
related talks
 13mWebAssembly Debugging Demystified
 52mWebAssembly: Taking Your C++ and Going Places
 46mWebAssembly (Digging a bit deeper)
 26mNavigating Strategies for Debugging WASM
 24mNo More Printf: Interactive Debugging Wasm for web and server
 32mWebAssembly Demystified
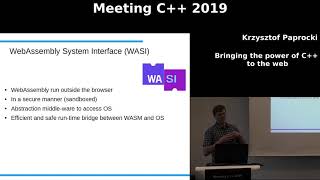 39mBringing the power of C++ to the web
 01h 30mApplied WebAssembly: Compiling and Running C++ in Your Web Browser