Monitoring and Centralized Logging in Ceph

summary
Shows a concrete stack: Prometheus + Alertmanager + Grafana for metrics and Loki + Promtail for centralized logs, with dashboards embedded in the Ceph Dashboard V3. Identifies a real problem — a single manager-side exporter overloads MGR on clusters with thousands of OSDs — and replaces it with a per-node Prometheus exporter that reads Ceph socket files to cut manager load and scale. Logs are compressed, retained by policy, buffered on network outages, and viewable live; overall solution is deployed and working in demos.
AI-written summary · about
chapters (12)
- 0:00Introduction and speaker background
- 1:06Importance of monitoring in Ceph
- 2:54Prometheus setup and configurations
- 4:40Grafana dashboards in Ceph
- 8:17Collecting metrics in Ceph
- 9:41Scaling Prometheus exporters
- 11:27Centralized logging overview
- 13:14Loki and Promtail architecture
- 15:00Centralized logging performance
- 17:53Demo of alerts and notifications
- 22:40Demo of centralized logging in Grafana
- 24:53Q&A session
related talks
 33mMonitoring Ceph with Prometheus
 38mEnhancing Ceph Monitoring at CERN: Our Approach and Solutions
 29mParanoid Observability –Success Stories and Misfortunes observing an observability stack
 34mDay 2 Operations : Make Friends with Your Ceph Cluster
 24mPractical Kubernetes Monitoring with Prometheus
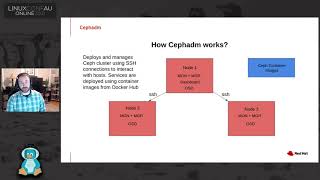 16mTips and Tricks for Managing and Administering Ceph Clusters
 05mHealthier Ceph Clusters with Ceph-medic
 27mObservability with Prometheus and beyond