Profiling and optimizing a Spark job with Babar #bbuzz

summary
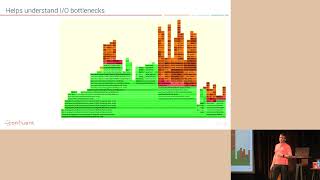
Criteo’s open‑source profiler Babar attaches a jar to executor JVMs, samples stacks and OS metrics, and emits an HTML report with six tabs and flame graphs showing CPU hotspots across all executors. On a cluster reading ~15 PB/day with >4,000 nodes (~100k cores), Babar finds shuffle serialization and Spark’s object size estimation costing 18–30% CPU and shows heap 200 GB vs physical 300 GB; switching to specialized serializers yields about a 40% CPU gain. Babar works for pre‑production tuning; it adds a few percent CPU and tens of MB memory.
AI-written summary · about
chapters (10)
- 0:00Introduction
- 1:25Why Spark
- 1:44Problems with Spark
- 2:36Why Babar
- 4:07Architecture
- 5:43Frame graphs
- 8:10Shuffle stage
- 10:43Memory allocation
- 12:16Memory tuning
- 14:50Conclusion
related talks
 30mOptimize Spark Jobs Using Its UI
 29mApache Spark Performance Tuning Session with Delight
 23mProfiling & Performance-Tuning Your Hadoop Pipelines
 21mKafka Streams, profiling, framegraphs, Oh My!
 31mProfiling Formats and Why You Should Care
 34mHive on Spark #bbuzz
 19mApache Beam pipelines at 100TB+ scale using Apache Spark
 21mAvoiding Spark Pitfalls at Scale