Kafka Streams, profiling, framegraphs, Oh My!
summary
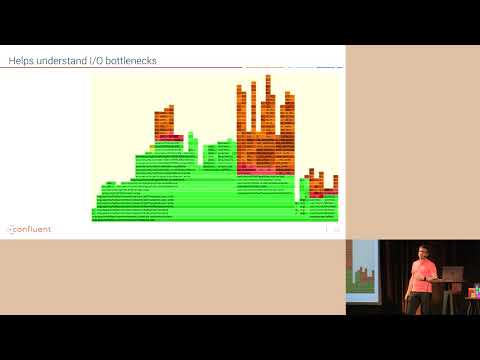
Shows how async-profiler plus flame graphs and Java Flight Recorder expose where a Kafka Streams app actually spends time — e.g., 15–20% in GC, ~10–20% in RocksDB compaction, heavy SSL entropy cost in writes — and how profiling reveals hidden library costs. Replaces inefficient cache flush code and increases cache size, cutting cache flush cost from 23% to 5%. Reuses buffers in fetch/serde paths to get a 30x speedup for small-message clients. Covers attaching profilers in Docker and GKE constraints.
AI-written summary · about
chapters (12)
- 0:00Introduction
- 0:35Why profile your application
- 4:17Other tools
- 5:03Flame Graph
- 9:14Understanding the code
- 12:14Recap
- 14:32Lock contention
- 15:49Timing bugs
- 16:26Allocation profiling
- 17:32Improved performance
- 18:55Kubernetes Engine
- 19:52Conclusion
related talks
 01h 00mIn Depth Kafka Streams
 03mInterview
 24mThe Cost of Apache Kafka
 46mKafka Streams at the Big Data Crossroads at Lightning Speed
 39mEvaluating Streaming Framework Performance for a Large-Scale...
 49mEnriching Kafka Applications With Real-time Contextual Data
 50mApplication development and data in the emerging world ...
 41mKafka as a Platform: The Ecosystem from the Ground Up