Catching the 137-Killer: A Java Memory Forensics Investigation

summary
A small Quarkus crawler that issues ~300 parallel HTTP requests (about 150 threads) repeatedly runs into Kubernetes exit code 137 because container RSS crosses a 512 MB limit. Investigation uses Grafana graphs, heap dumps, jcmd/heap histograms and Native Memory Tracking, and native tools like pmap to show large thread stacks (~2 MB each) plus metaspace and direct buffers. Attempts to shrink stacks, tune JVM flags and c-library trimming reduce but do not eliminate OOMKills.
AI-written summary · about
chapters (11)
- 0:00Java memory mystery
- 3:51Evidence at crime scene
- 11:40Killer’s profile and clues
- 15:00137 killer’s signature
- 17:07Java memory breakdown
- 23:50Native memory tracking
- 27:08Kubernetes and JVM limits
- 33:11Memory analysis tools
- 35:21Investigation’s unexpected turns
- 39:17Key lessons and prevention
- 41:28Final thoughts and Q&A
related talks
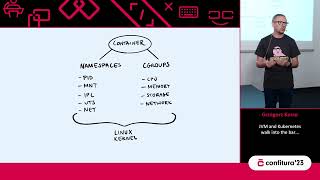 50mJVM and Kubernetes walk into the bar...
 45mScooby RAM, where are you?
 02h 41mCures for OOMKills, Warm-ups, and Slowness in JVM Containers
 32mWho Killed My Pod? #Whodunit
 43mA Glance At The Java Performance Toolbox
 40mA Glance At The Java Performance Toolbox
 42mContainers & Java: What I wish I have been told!
 58mContainer Friendly Java 9