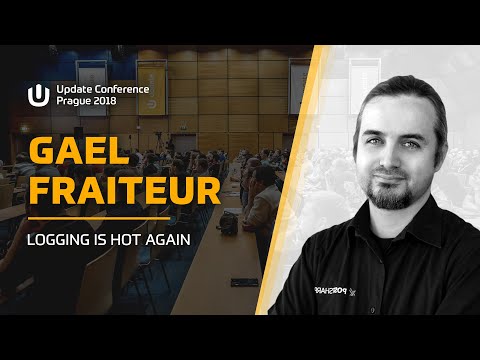
Logging Is Hot Again
summary
Logging moves from lines to searchable events: demos ship structured Serilog JSON through Elasticsearch + Kibana using Beats and Logstash, show aggregations by method and argument and a correlated two-service trace by propagating an operation-id header and using an ASP.NET action filter. Options for instrumentation include agent profiling, middleware/DI or PostSharp build-time instrumentation; Activity/OpenTracing concepts (spans, tags, baggage) are supported by .NET diagnostics but ecosystem tooling for .NET is still immature. Sampling traces reduces cost and works.
AI-written summary · about
chapters (14)
- 0:00Intro
- 4:53Logging is changing
- 7:40Logging vs Monitoring
- 9:51Logging and Tracing
- 14:13Elastic Stack
- 15:04Elastic Stack Demo
- 19:41Azure Log Analytics
- 22:50Automatic Code Instrumentation
- 27:06Open Tracing
- 29:11What is Innet
- 31:43What is Activity
- 33:36HTTP Correlation
- 37:28Example
- 40:51First Demo
related talks
 01h 01mLogging, tracing and metrics: instrumentation in .NET and Azure
 54mSerilog: Instrumentation that Works for You
 54mLogging, Metrics and Events in ASP NET Core
 34mDistributed Tracing, Lessons Learned
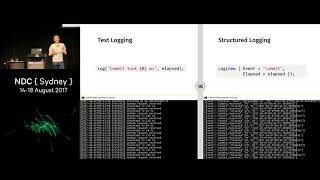 59mSerilog: Instrumentation that Works for You
 01h 00mPractical OpenTelemetry for .NET
 52mModern Observability and Event Driven Architectures
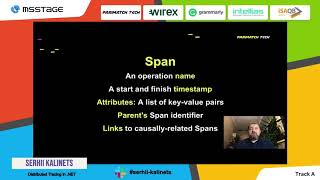 41mDistributed Tracing in .NET