Visualising networks
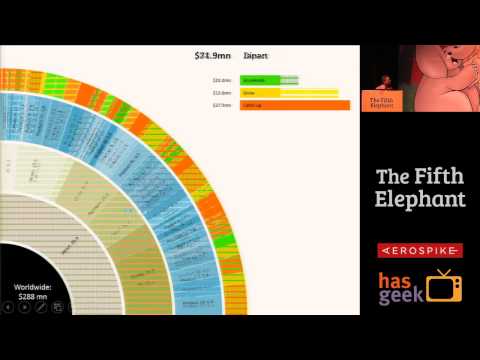
summary
Shows methods for visualising network data both at large and small scales, using traditional hierarchical and node-link diagrams alongside newer techniques like attribute-driven layouts, pivot graphs, and grouped means. Applies these visual techniques to real-world datasets from areas such as social media, telecoms, airports, banking, and unusual sources like fraudulent tea auctions, examination halls, and works of fiction to reveal the patterns and stories in the networks.
AI-written summary · about
related talks
 20mAttack of the Graph: Visual Tools for Cyber Analysis
 02h 47mNetwork Analysis Made Simple
 01h 38mNetwork Science for Fun and Profit
 01h 26mBuilding an Interactive Network Graph to Understand Communities
 01h 33mBuilding an Interactive Network Graph to Understand Communities
 34mVisualising Multi Dimensional Data
 42mVisualising Connections
 24mHands-On Network Science