Achieving Observability into Your Application with OpenCensus

summary
OpenCensus provides a consistent, language‑specific library (seven languages supported) that automatically propagates trace context, collects RPC latency and error metrics, and exports to backends like Prometheus + Stackdriver exporters or Zipkin and SignalFx. The demo runs a Java server + Go client, shows pprof and real‑time z‑pages, and reports mean RPC latency ~35 ms; traces and tagged metrics are successfully assembled end‑to‑end and sampled with configurable strategies.
AI-written summary · about
chapters (9)
- 0:00Start
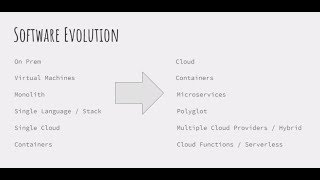
- 0:21Microservices
- 1:39Distributed Tracing
- 3:11Trace propagation
- 4:49Application level Metrics
- 5:20Observability
- 5:47Difficulties
- 6:20OpenCensus
- 7:11Tagging
related talks
 59mDistributed Tracing and Monitoring with OpenCensus
 01h 02mDistributed Tracing and Monitoring with OpenCensus
 16mPragmatic execution tracing
 35mPractical and Useful Latency Analysis using Istio and OpenCensus - Varun Talwar
 38mDistributed Microservices Metrics and Tracing with Istio and OpenCensus
 55mCloud-Native Observability with OpenTelemetry
 27mEnd-to-end visibility in the cloud w/OpenTelemetry
 45mOpen Source for Better Observability