Plotting with Matplotlib; Telling Static, Animated, & Interactive Stories
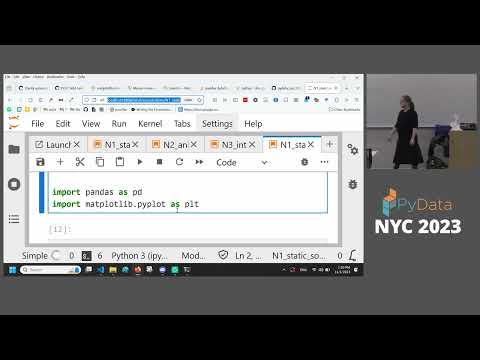
summary
90-minute tutorial that teaches the Matplotlib object model by building real outputs: exploratory charts from the Palmer Penguins dataset, a linked animation that highlights individual rows, and a converted interactive visualization that responds to selection. Code uses pandas and Matplotlib, runs in notebooks or Colab, and the demo projects complete successfully within the session. Emphasis is on which methods and artist objects change, how many plotting primitives are involved, and concrete save/animation steps.
AI-written summary · about
chapters (13)
- 0:00Matplotlib introduction
- 1:06Matplotlib object model
- 3:59Setting up the tutorial with Palmer penguin data
- 8:14Figures and axes
- 12:14Artist objects
- 14:26Histogram and heatmap
- 16:57Color bars and labels
- 23:45Subplots and composition
- 26:57Scatter plot and legend
- 31:26Static plotting activity
- 42:55Bar chart customization
- 51:54Animated plots
- 55:14Layering and highlighting
related talks
 29mInteractive visualization for the curious
 01h 27mLeveling Up Your Storytelling and Visualization Skills
 01h 28mPython Visualization for Exploration of Data
 02h 31mTech Tutorial: Data visualization in Python
 40mUse animated data stories in Jupyter to present
 30mVisual Data Storytelling with Blender and Python
 30mFrom plotting to chart porn - Creating slick charts with Matplotlib
 01h 38mEffective Data Visualization