Storing Continuous Benchmarking Data in Prometheus

Talkat PrometheusDay Europe 2022 · on Tuesday, 2022-05-17· at 15:25· Pavilion 3, Room F | Level 2 | Central Forum + Live Stream, Feria Valencia, Spain + Live Stream·
summary
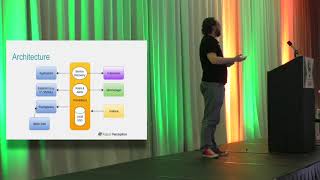
Argues that embedding Prometheus metrics for inputs and outputs into benchmark runners captures application, infra and load parameters together so you can query why performance changes; implements a setup that keeps benchmarks ephemeral but sends all metrics to a long‑lived Prometheus/ Promscale stores historical runs, reused by Grafana dashboards; uses prombench to spin up clusters and reproduces benchmarks end‑to‑end; outcome: retrospective analysis and organized run metadata, and it forces better observability.
AI-written summary · about
chapters (8)
- 0:00Intro
- 0:11Benchmarking How do you do it?
- 3:50Architecture
- 6:10Storing Results
- 8:52Reuse your 011y
- 11:26Summary
- 12:27Getting started
- 14:03We're Hiring!
related talks
 32mDemocratizing Application Monitoring with Prometheus
 30mIntro: Prometheus
 09mFun and Games: Using Prometheus to aggregate disparate metric dat...
 36mObservability with Prometheus and Beyond: Leveraging Cloud-native Technologies Outside of Cloud
 24mFrom Monitoring to Observability: 10 Things to Do with Prometheus in 2020
 36mDoing Things Prometheus Can’t Do with Prometheus
 42mPrometheus Intro and Deep Dive
 10mPrometheus for Monitoring Metrics - Database Monitoring Tools