Every Millisecond Counts Performance & UX

summary
Cites concrete losses and gains: losing $900 million in 100ms and 8 million visits in 0.4s, Amazon loses ~1% revenue per 100ms (≈£615m in 2014), Google drops 20% if search is 0.5s slower, Etsy sees +12% bounce for 160KB extra images. Recommends metrics and tools: use Speed Index and the WebPageTest API, enable HTTP/2 requires TLS and Let’s Encrypt, apply DSSIM-driven image compression (~0.02 threshold), use ESI fragment caching, prefetch/preload/server-push and CDN edge image management to reduce real user latency.
AI-written summary · about
chapters (32)
- 0:00Introduction
- 1:20Why does performance matter
- 3:00Conclusions
- 4:30What makes a web page
- 6:00How do we fix this
- 7:45Using the Speed Index
- 10:50Edgeside Includes
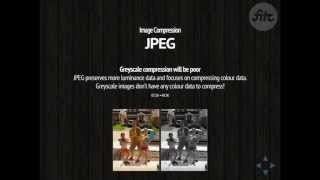
- 13:30Image Compression
- 16:00Perceptional Quality
- 17:50Structural Similarity for Images
- 21:20Image Size Comparison
- 22:00Predictive Browsing
- 23:05DNS Prefetch
- 23:30Linkrel
- 23:50Preconnect
- 24:10Prerender
- 24:30Preload
- 25:35Header
- 27:10HTTP 2 Server Push
- 30:00Summary
- 30:30Time equals money
- 31:20Ads
- 32:05Compression
- 33:15Prefetching
- 36:10HTTP2 Upgrade
- 38:10Compression Engines
- 39:10Browser Support
- 40:20Prefetch
- 41:50DSS IM
- 43:25Security Implications
- 44:55Benchmarks
- 47:30HTTP to TLS