Be Good Friends with Query Planner
summary
Postgres tends to pick good plans but misestimates when stats are stale or cardinality grows with many joins; run ANALYZE after big updates and use Auto_explain log_analyze sparingly because it adds timing overhead (disable log_timing or use per-backend settings and sampling). For live inspection use PG show plans ~15% overhead or PG query_state (requires core changes); proposal targets an in-core per-node plan dump. Plan fixes: PG Hint Plan is case sensitive and fails if the hinted plan isn’t a candidate or GQO is active. Also proposed: EXPLAIN BUFFERS with storage I/O counts.
AI-written summary · about
chapters (8)
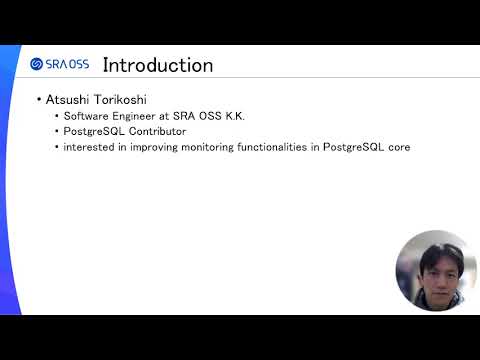
- 0:00Introduction
- 1:18How planner works
- 5:16Why planner fails
- 7:05Monitoring execution plans
- 11:47Real-time plan inspection
- 15:23Analyzing execution plans
- 19:18Taking action to improve
- 24:06Summary and best practices
related talks
 52mUnderstanding PostgreSQL Query Plans (aka EXPLAIN)
 31mpg_stat_advisor: Optimizing PostgreSQL Planner with Insights
 23mBest Practices for Tuning Slow Postgres Queries
 29mExplaining the Postgres Query Optimizer
 50mPostgreSQL Query Performance Insights
 47mIdentifying Slow Queries and Fixing Them!
 36mAdvice is seldom welcome but efficacious
 50mImproving Postgres' Efficiency