Logging, Metrics, and Tracing with Node.js
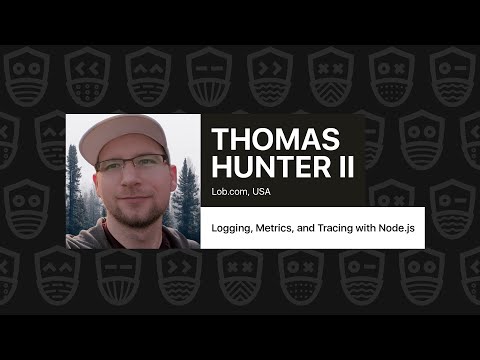
summary
Logging metrics and tracing are framed as three concrete observability tools with runnable examples: a winston logger singleton that emits JSON and a request-scoped child logger with UUID request ids, statsd middleware pushing timing and status codes into a statsd → graphite → grafana stack, and Zipkin hooks that produce spans (one example shows a span at 131 ms and an actual Lob request at ~850 ms). Dashboards surface six 500 errors in 24 hours and code shows where headers and stacks get emitted.
AI-written summary · about
chapters (9)
- 0:00Intro
- 2:19Winston Example
- 3:28Common Logging Conventions
- 5:48What do logs look like?
- 7:48Example Code
- 9:04What do Metrics look like?
- 10:09What is Distributed Tracing?
- 11:47Example Tracing Implementation
- 14:38What does Tracing look like?
related talks
 20mMonitoring, And Visualizing your Node.JS server with Open Source tools
 25mTracing Node. The Open Source Edition.
 31mConsole.loggers Anonymous: A Debugging Roadmap from Local to Production
 30mNode.js Q&A
 19mUnlocking Observability with React & Node.js
 17mUnlocking Observability with React & Node.js
 46mHow to Properly Blame Things for Causing Latency
 44mThe Holy Trinity of Observability: Logs, Metrics, and Traces