Beyond Regression Testing: Observability for QA

summary
Describes a concrete pipeline: OpenTelemetry → Prometheus + Grafana → Fluent Bit → Alertmanager, capturing metrics logs and traces from services and exposing health endpoints. Builds a self‑detection layer and scripts for automated restarts and playbooks for manual steps, which measurably cut mean time to restore (30% in nine months, later 75%) and drop change‑failure rate (10% → 4% → <1%), with positive ROI around nine months.
AI-written summary · about
chapters (8)
- 0:00Introduction and context
- 1:09The necessity of monitoring
- 3:50Lessons from production issues
- 6:16Defining observability
- 8:02Building a detection system
- 12:20Self-healing logic
- 14:50Metrics and future outlook
- 19:07Question and answer session
related talks
 21mJourney from Broken Dashboards to O11y Maturity
 28mScaling Observability for Real-Time Personalization Engines
 28mEnd-to-end CI/CD observability with open source
 36mThe road to world-class observability
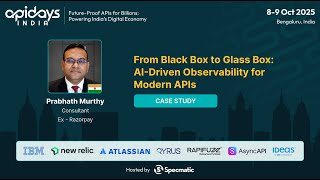 21mFrom Black Box to Glass Box: AI-Driven Observability for Modern APIs
 41mCustomer Centric Observability at Scale Leveraging AIOps & OpenTelemetry
 56mFull-stack observability and application monitoring with
 31mCharting New Frontiers: The Evolution of Observability in Cloud Environments