Deterministically Debugging Go Programs

summary
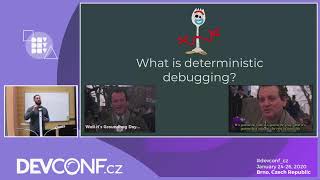
Deterministic debugging captures a failing Go run once and replays it exactly using Delve + rr backend, turning intermittent failures that occur maybe 1-in-100 or 1-in-1000 into repeatable sessions. It records syscalls (via ptrace shims), traps RDTS/CPU id, uses single-threaded replay with a user-space scheduler, and preserves memory layout so breakpoints and addresses match. Traces are portable artifacts that can be shared; you can also do reverse execution to step backward. Requires Linux and incurs runtime overhead during recording.
AI-written summary · about
chapters (28)
- 0:00Introduction and welcome
- 1:21About the speaker
- 2:06What is deterministic debugging
- 3:53Groundhog Day analogy
- 6:46How it works technically
- 8:16Recording and replaying
- 10:37VM vs user space recording
- 11:56Pros and cons of VM recording
- 13:40User space recording
- 15:34The solution: Mozilla rr
- 17:16Eliminating non-determinism
- 18:22Controlling CPU instructions
- 20:28Thread scheduling
- 22:08Handling system calls
- 24:18Memory layout
- 25:02Shared memory and signals
- 26:25Uncontrollable factors
- 27:10Pros and cons of this approach
- 28:34Key benefits of rr
- 30:22Reverse execution
- 32:02Limitations of rr
- 34:27Using rr with Delve
- 36:01Installation requirements
- 37:11Replay workflow
- 38:38Integrated debugging
- 39:33Scripting Delve
- 41:30Demonstration
- 45:31Conclusion
related talks
 50mDeterministic debugging with Delve
 04mA New Debugging Mindset
 14mDebugging debuggers!!!
 21mAbstract Debuggers: Exploring Program Behaviors Using Static Analysis Results
 43mDebugging Treasure Hunt
 43mDebug Like a Scientist!
 37mDebugging Without Borders
 35mBe Smug, Debug Why You Should Be a Delve Power User