Monitoring Applications in AKS

summary
Shows how Azure Monitor and Prometheus are integrated to collect AKS metrics by using Prometheus annotations on pods to drive scrapes, with metrics exported to a Log Analytics workspace. Demonstrates deploying YAML and a metrics-collector as Kubernetes containers, querying metrics in Log Analytics and visualizing them with Grafana (via the Grafana plugin), producing roughly 7,000 Prometheus records over a few hours on a small cluster and exposing metrics at standard Prometheus endpoints.
AI-written summary · about
chapters (12)
- 0:00Introduction and thanks
- 1:08Talk overview and speaker intro
- 4:31Why monitoring matters
- 8:28AKS infrastructure overview
- 12:10Azure Monitor basics
- 16:35Prometheus in AKS
- 21:29Telegraf and Grafana roles
- 28:01Demo setup and annotations
- 36:17Log Analytics agent config
- 38:21Key takeaways and integration benefits
- 45:13Flexibility and unified metrics
- 49:50Q&A on monitoring tools
related talks
 24mPractical Kubernetes Monitoring with Prometheus
 37mMonitoring Kubernetes with Prometheus
 19mKeynote: Monitoring Kubernetes Clusters with Prometheus
 32mDemocratizing Application Monitoring with Prometheus
 01h 01mDevOps with Azure Kubernetes Service
 46mWhat's new in Azure Monitor?
 30mImplementing Prometheus and Grafana in a Kubernetes Cluster on EKS
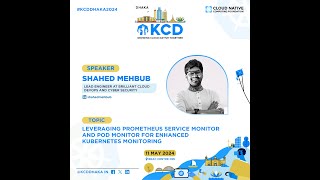 46mLeveraging Prometheus Service Monitor and Pod Monitor for Enhanced Kubernetes Monitoring