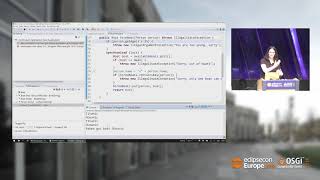
Debug Java code like a Pro

summary
Live demos show Eclipse JDT debugging in action: conditional, method and hit‑count breakpoints plus watchpoints and exception breakpoints; new Oxygen features include tracepoints (console logging), trigger breakpoints that activate other breakpoints, and showing the last returned value in Variables. Examples cover remote debugging via JVM agent, launch groups that wait for a console regex, deadlock detection (threads and locks highlighted), custom object detail formatters and logical structures to simplify Variables view.
AI-written summary · about
chapters (12)
- 0:00Intro
- 1:57Customize Debug Perspective
- 8:34Breakpoints
- 11:52Exception Break
- 13:58Conditional Breakpoints
- 16:39Tracepoint
- 18:27Trigger points
- 24:37Breakpoint
- 25:49Launch Group
- 27:35deadlock detection
- 30:19logical structure
- 33:57Conclusion