Tracing: A journey to tactical insights

summary
A prototype event pipeline collects sidecar traces and pushes them into Kafka, runs complex event processing with Apache Flink, and writes postprocessed records to PostgreSQL and Elasticsearch for search and Prometheus for metrics. The system extracts features from binaries and sandbox runs to classify suspicious activity in near real time, uses sampling to limit volume to about 5 GB/day, and surfaces service bottlenecks and malicious patterns successfully in the prototype.
AI-written summary · about
chapters (9)
- 0:00Introduction to tracing
- 2:23Crime scene analogy for tracing
- 7:08Tracing concept and racing traces
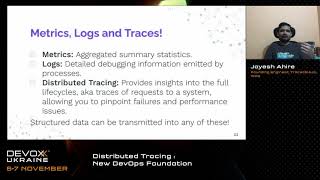
- 12:03Tracing in monitoring and metrics
- 19:56Distributed tracing concept
- 26:55Tracing service prototype
- 30:10Prototype architecture and tools
- 35:23Incident handling with tracing
- 40:05Q&A and closing remarks
related talks
 34mDistributed Tracing, Lessons Learned
 24mData analytics with distributed tracing data
 30mDebugging at Scale Using Elastic and Machine Learning
 31mFrom Alerts to Insights: Performing Trace-Based Causation at Scale
 45mMastering Distributed Tracing: Insights from Building a Platform from Scratch
 24mDistributed Tracing : New DevOps Foundation.
 01h 07m"Adding Observability to Distributed Systems"
 28mIntro: Jaeger