A Practical Introduction to Open Telemetry
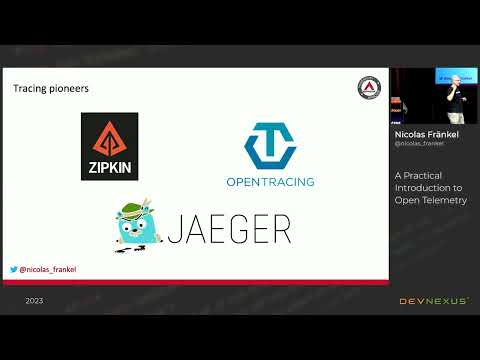
summary
Practical demo of OpenTelemetry with Jaeger as the backend, Apache APISIX as API gateway, a Kotlin Spring Boot catalog, Python and Rust services, all run in Docker Compose and traced via the OpenTelemetry Java agent for auto-instrumentation that requires no code changes. Shows manual instrumentation with Spring annotations to capture product IDs, explains sampling tradeoffs, shows traces assembling across services, and confirms the demo works end-to-end with visible spans, timings and tags in Jaeger.
AI-written summary · about
chapters (11)
- 0:00Introduction and speaker background
- 1:24From monitoring to observability
- 8:34Three pillars of observability
- 11:30What is OpenTelemetry
- 15:48Auto vs manual instrumentation
- 19:20Demo setup and architecture
- 22:58Java auto instrumentation demo
- 29:46Tracing insights from the demo
- 37:27Sampling and performance impact
- 40:08Manual instrumentation details
- 44:58Key takeaways and conclusion
related talks
 38mPractical introduction to OpenTelemetry tracing
 41mPractical introduction to OpenTelemetry tracing
 30mPractical introduction to OpenTelemetry Tracing
 51mPractical introduction to OpenTelemetry tracing
 45mPractical introduction to OpenTelemetry tracing
 43mPractical Introduction to OpenTelemetry Tracing
 28mPractical Introduction to OpenTelemetry Tracing
 38mPractical introduction to OpenTelemetry tracing