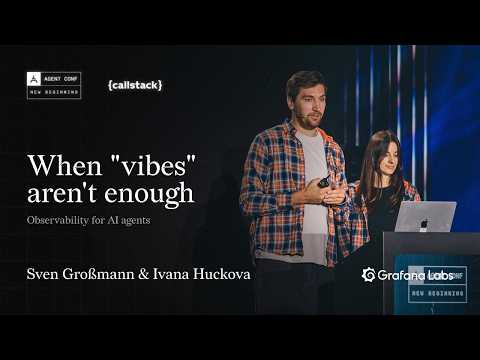
Agent Observability Beyond Vibes
summary
Grafana Assistant serves more than 18,000 organizations and Grafana builds an observability stack that measures four trust dimensions: performance, behavior, iteration, and security. Live metrics track latency, error rate, cost and time‑to‑first‑token; a timestamp added to a system prompt breaks prompt caching; conversation traces show every model and tool call; failed production conversations become versioned regression tests run as CI/CD gates; an LLM judge scores groundedness and synchronous request guards block out‑of‑scope requests before the model sees them.
AI-written summary · about
chapters (8)
- 0:00Introduction and team intro
- 1:27Why vibes don’t scale
- 3:31Grafana Agent Observability
- 4:57Live traffic monitoring
- 8:24Finding misbehaving conversations
- 11:57Iterating without regressions
- 15:53Guarding against misuse
- 20:03Closing and summary
related talks
 26mAI-Driven Cloud Observability: Reduce toil and amplify time to resolution
 30mBuilding Grafana Assistant
 46mObservability engineer, the best friend you never knew you had
 23mAI/ML + open source observability
 44mGrafana Labs Customers: What We've Learned Building Observability at Massive Scale
 34mThe Grafana Stack: Building a Highly Available, Scalable Observability Platform
 21mSpeed Up Troubleshooting with Integrated Application and Infrastructure Observability
 41mMetrics Applied